The “rule”
The following empirical “rule” to determine the hemisphere of visibility of a total solar eclipse was recently mentioned on the Solar Eclipses Mailing List (SEML):
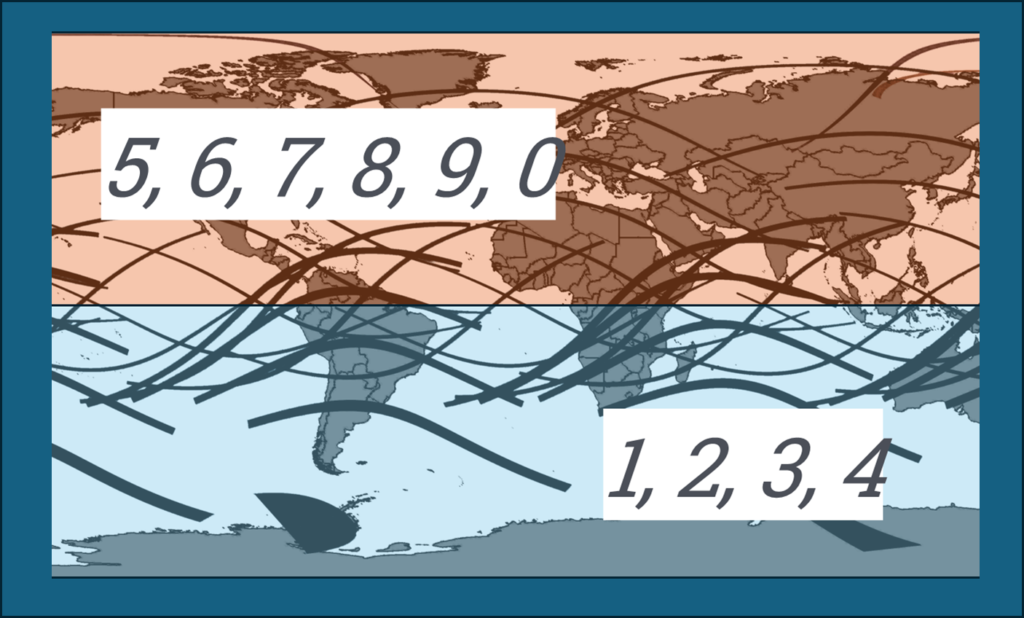
To predict whether an eclipse should be visible from the Northern or Southern Hemispheres: write down a year which has a total solar eclipse and add the last two digits together. If the sum still has two digits, repeat the addition [till you have a single digit]. Then, if the result is 1, 2, 3, or 4, the eclipse track is mostly south of the equator. If the final sum is 5, 6, 7, 8, 9 or 0, the eclipse is normally a Northern Hemisphere event.
This rule applies not only to the eclipses of the 20th century (with a few exceptions) but to almost all those in the 19th and 21st centuries as well.
Let’s apply the rule to the 2028 July 22nd total solar eclipse, the path of which is completely south of the Equator. The last two digits of the year are 28, so 2 + 8 = 10 and 1 + 0 = 1, and the rule correctly predicts that the eclipse path is mainly in the Southern Hemisphere.
The rule occasionally fails. Let’s consider the famous 1991 July 11th total solar eclipse, the path of which ran mainly north of the Equator. The last two digits of the year are 91, so 9 + 1 = 10 and 1 + 0 = 1, and the rule predicts a path mainly in the Southern Hemisphere.
It seems rather odd that the year when a total solar eclipse occurs has anything to do with the hemisphere of visibility. What we are going to explore is why the rule works in most cases, and how it might have been obtained. These ideas might have already been explored elsewhere: if they did, we are not aware of such exploration. The rule has been around for several decades, and we have occasionally seen it quoted, but with no explanation of why it works.
The exploration will go through Saros series and modular arithmetic, so let’s start!
Saros series and hemisphere of visibility of total eclipses
It is a well-known fact that solar eclipses, of any types, not just total, can be grouped into Saros series. A Saros period is a period of 18 years and 10/11 days, corresponding to 223 synodic months (period of New Moons), circa 242 draconic months (period of passage through the same lunar node) and circa 239 anomalistic months (period of passage through the perigee). Successive eclipses, separated by 1 Saros period, are very similar in nature and happen at similar latitudes. Eclipses slowly evolve through a Saros series: they start as small partial eclipses near one of the polar circles, slowly move towards the opposite polar circle while morphing from partial to full-silhouetted eclipses (total, annular or annular-total eclipses) and then back to partial eclipses.
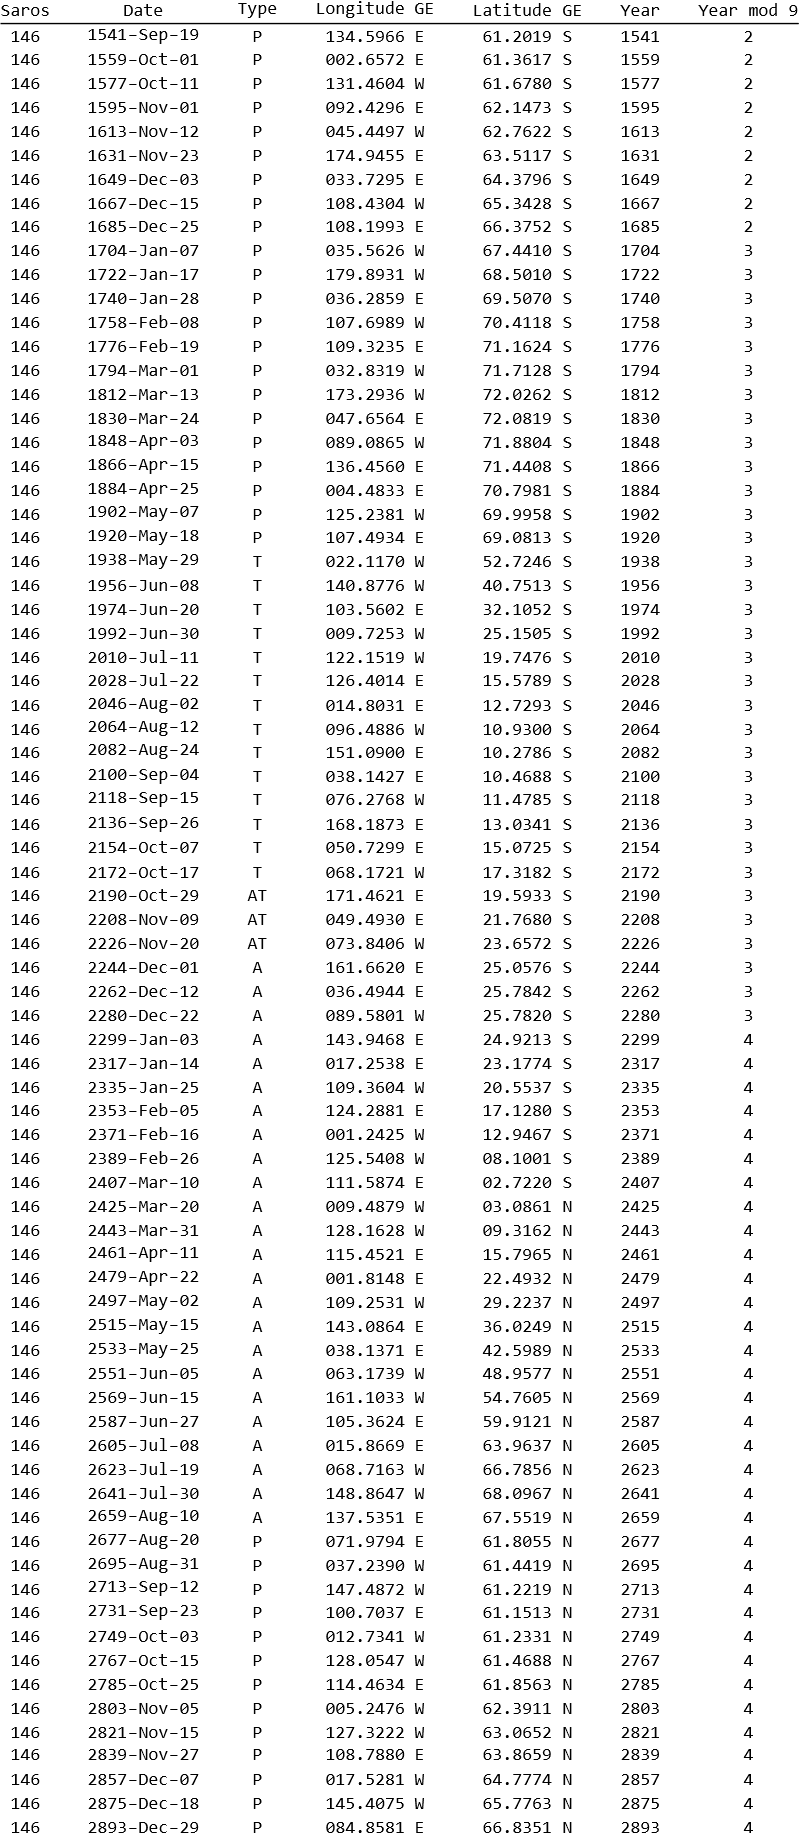
Here is an example of Saros series, containing the 2028 July 22nd total solar eclipse. Reported are the date of the eclipse, its type (P=partial, T=total, A=annular and AT=annular-total), the longitude and latitude of the point of greatest eclipse, the year and the reminder of dividing the year by 9. All eclipse data are based on John Irwin’s 30k solar eclipse canon (available here).
We can see the evolution from partial eclipses to full-silhouetted eclipses back to partial eclipses. The latitude of the point of greatest eclipse hovers around the Antarctic polar circle till the eclipses transition to be full-silhouetted, then it slowly moves north until reaching the Arctic polar circle when the eclipses re-transition to be partial.
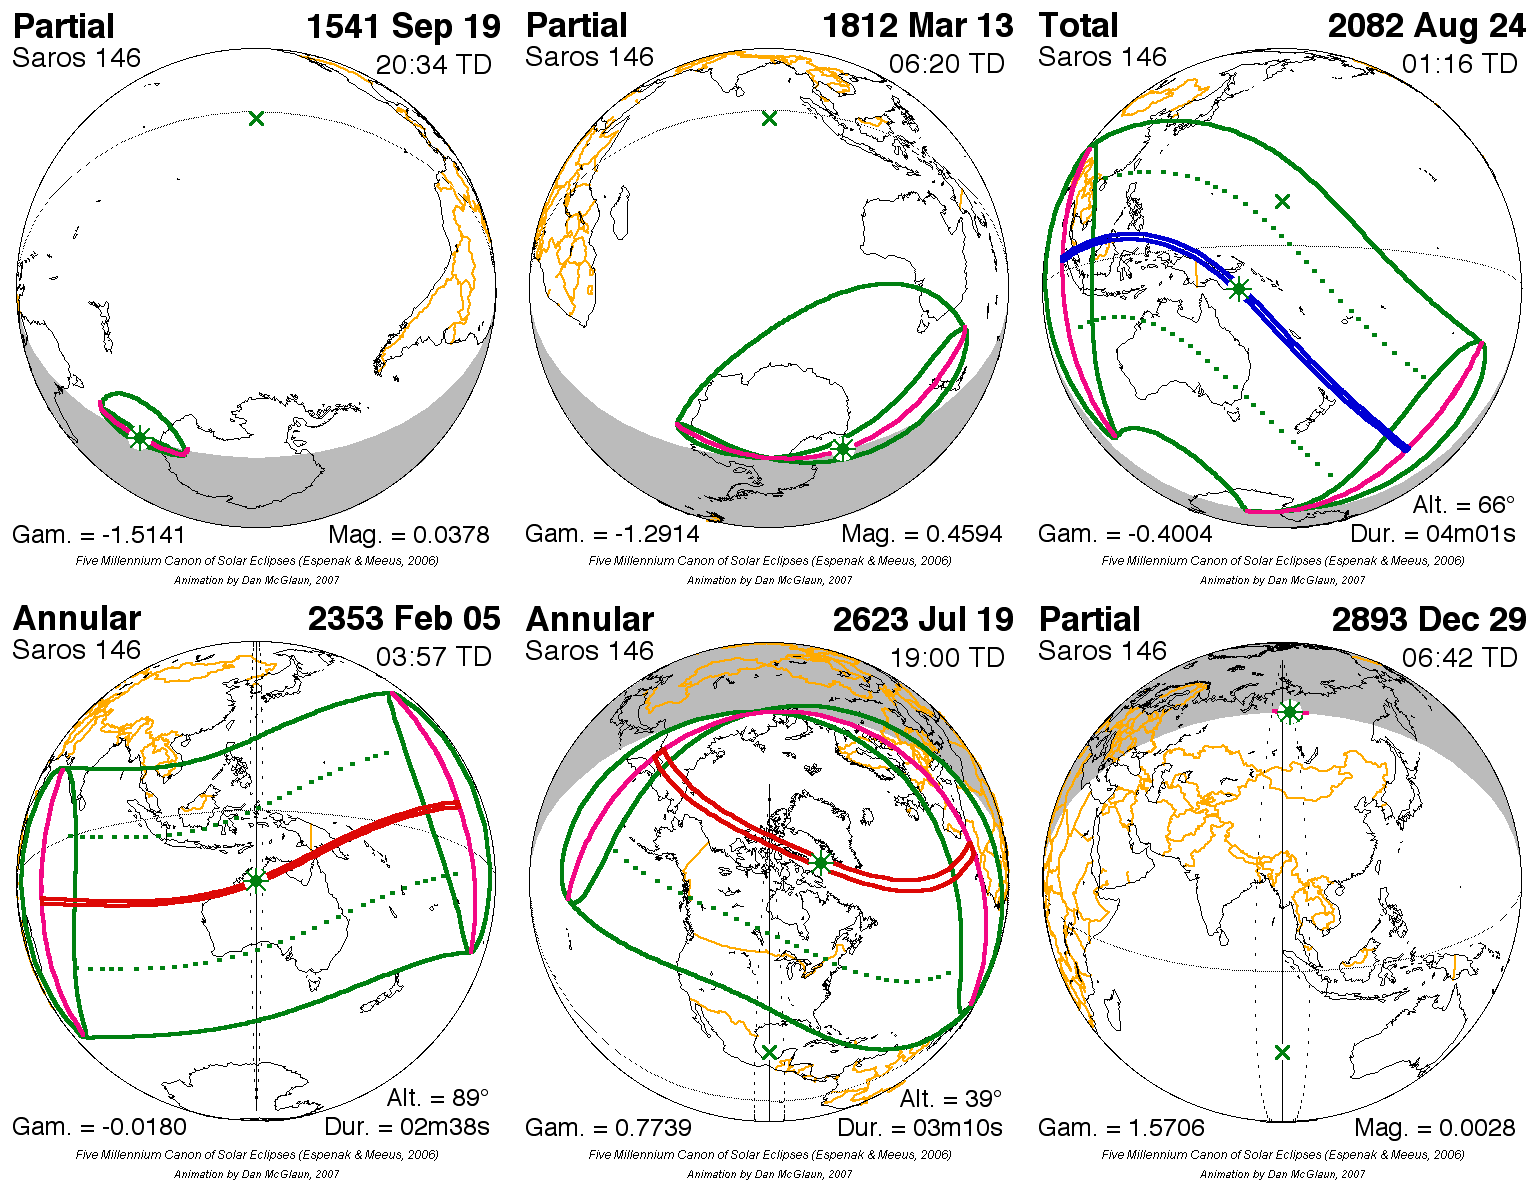
By observing Saros series 146, we can make a fundamental observation: the point of greatest eclipse of all total eclipses in the series is south of the Equator. For some eclipses part of the totality path might lie in the Northern Hemisphere, but, overall, most totalities stay in the Southern Hemisphere. An animation by Dan McGlaun based on the eclipse canon by Fred Espenak and Jean Meeus will make things even clearer (credit: NASA Eclipse web site). The path of totality is in blue, and the path of annularity is in red.
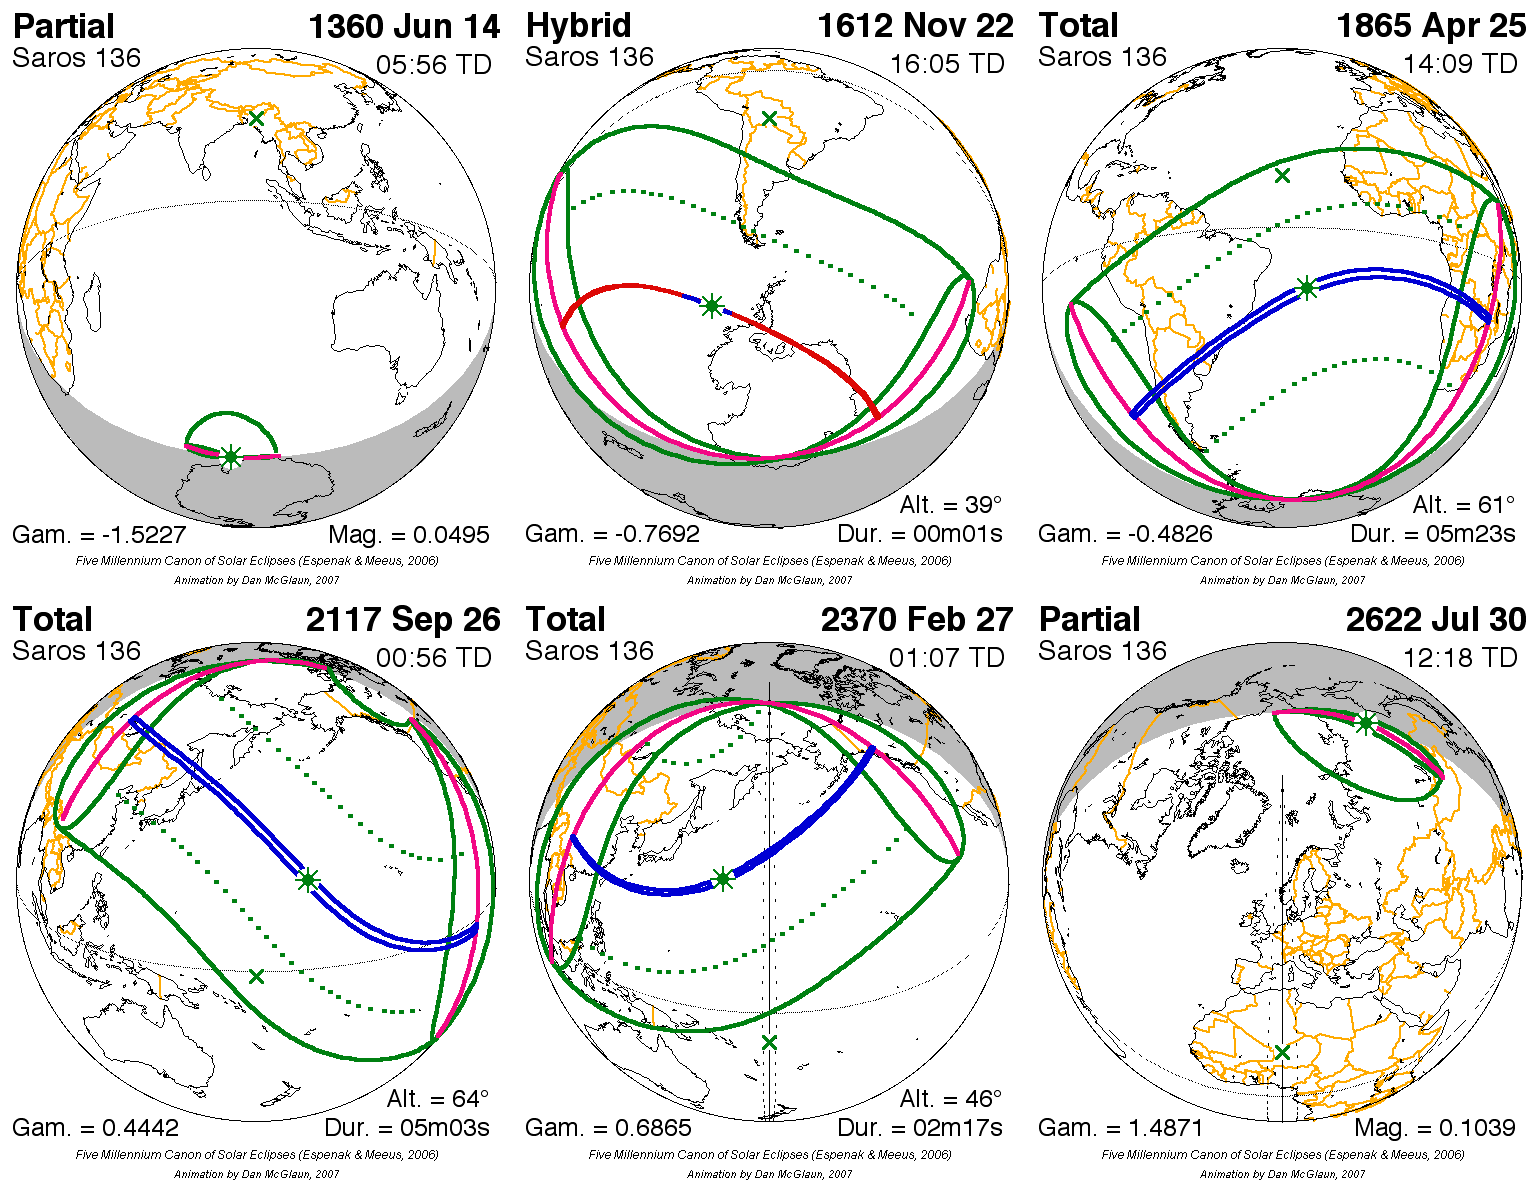
Quite a few Saros series share such characteristic: the point of greatest eclipse for most, if not all, total solar eclipses lies only in one hemisphere. Of course, there are exceptions, one notable for the present epoch being Saros series 136 (credit: NASA Eclipse web site).
Saros series and reminder by dividing by 9
Taking the year when an eclipse occurs, and summing up its digits till we get to a single digit number is equivalent to finding the reminder by dividing the year by 9. If the final single digit number is 9, we further reduce it to 0. This is a well-known fact from arithmetic. For example, if we take the 2028 July 22nd total solar eclipse, 2028 / 9 = 225 with a reminder of 3, but also 2 + 0 + 2 + 8 = 12, then 1 + 2 = 3.
Table 1 lists in the last column the reminder of dividing the year by 9. We observe than many consecutive eclipses in the Saros series have the same reminder. This is not at all surprising since one Saros period is ca. 18 years, and 18 is divisible by 9. Adding one Saros period does not change the reminder unless we go through the December-January boundary. A Saros period is 18 years and 10/11 days, so dates of consecutive eclipses in the same Saros series slowly go forward through the calendar year. At a certain point the boundary will be met. Overall, this only happens infrequently.
The empirical rule we are studying only consider the last two digits of the year and only applies to the 19th, 20th and 21st century. Let’s look at the computation the rule is performing for all total eclipses of Saros series 146.
In a slightly inconsequential departure from the rule, when the final digit is 9, it is further reduced to 0.
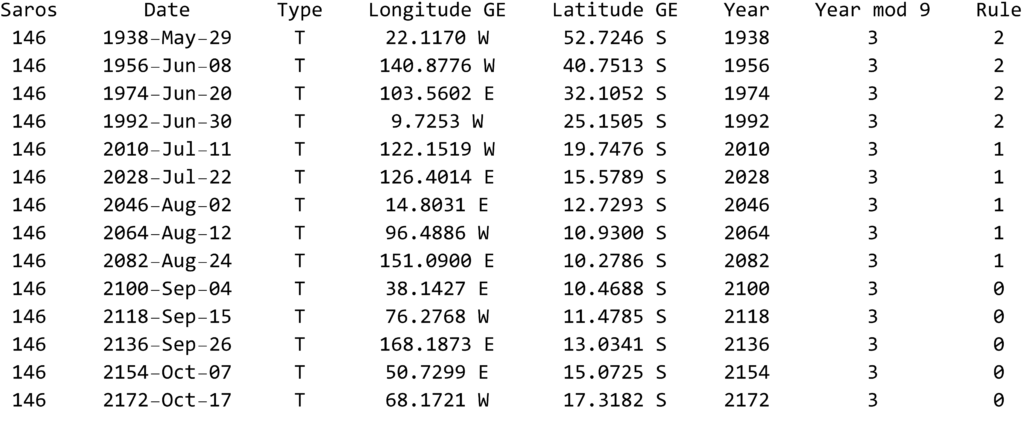
The year of all these eclipses gives the same reminder when dividing by 9. Because the rule only considers the last two digits of the year, the number that the rule computes is not quite this reminder, but something related. The number the rule computes stays constant within a century but decreases by one unit when crossing the boundary between centuries.
If we want to be more quantitative, first let’s consider the reminder by dividing by 9 of whole centuries: 1800 mod 9 = 0, 1900 mod 9 = 1 and 2000 mod 9 = 2. What the rule computes is the following:
(year – whole century) mod 9 = year mod 9 – whole century mod 9
We can again use the 2028 July 22nd total solar eclipse as an example:
(2028 – 2000) mod 9 = 2028 mod 9 – 2000 mod 9 = 3 – 2 = 1
We can now clearly see that what the rule is doing is related to finding the reminder of dividing the whole year by 9.
Putting all together
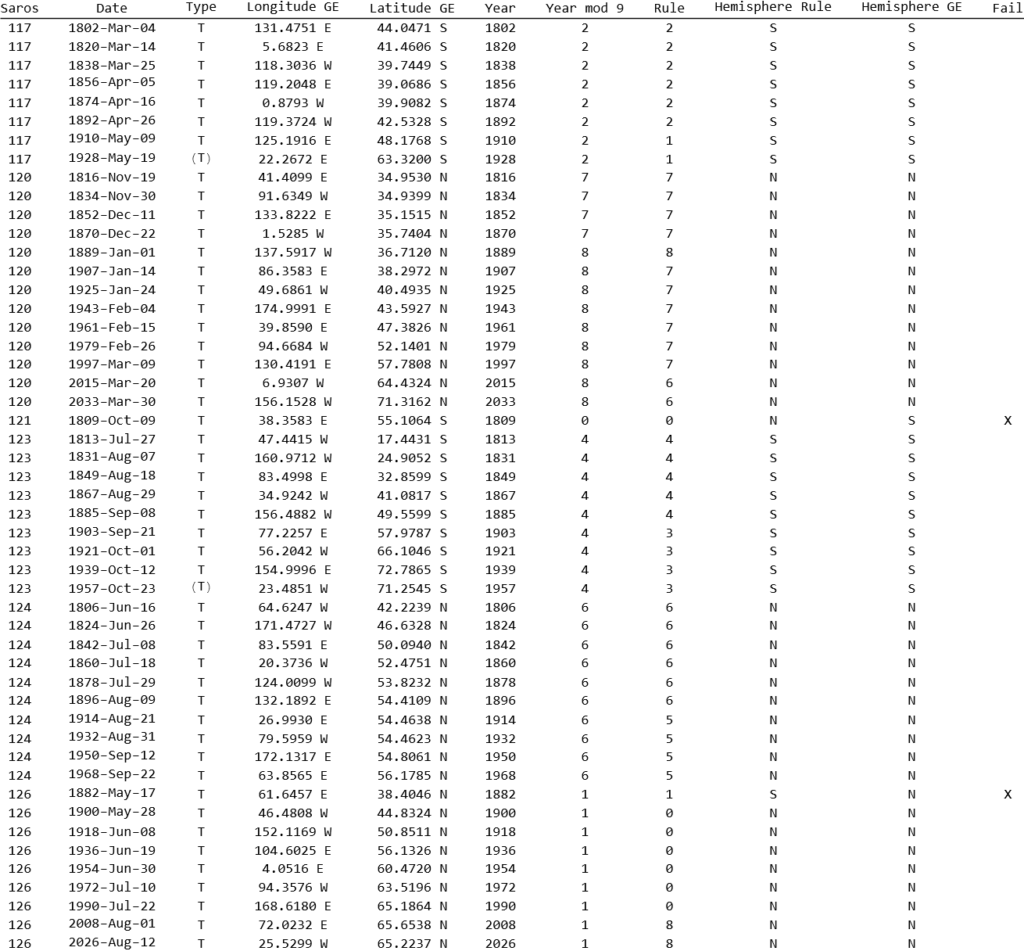
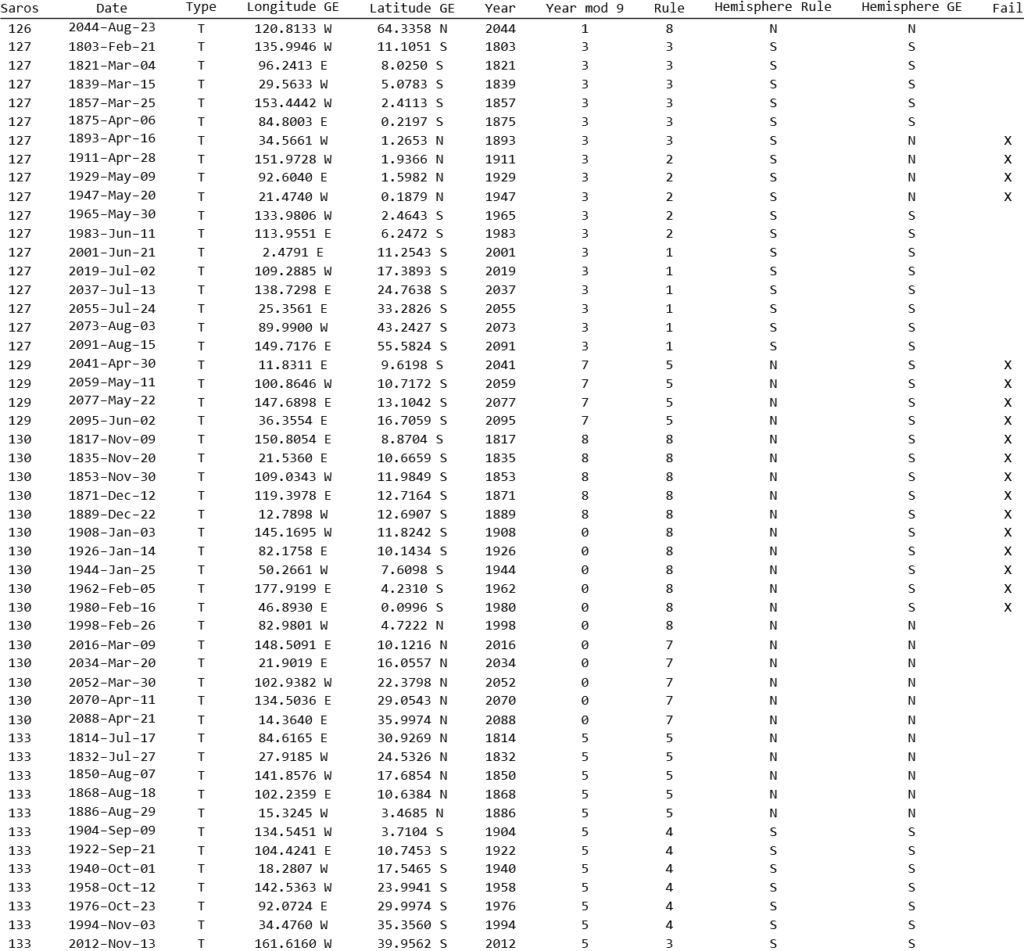
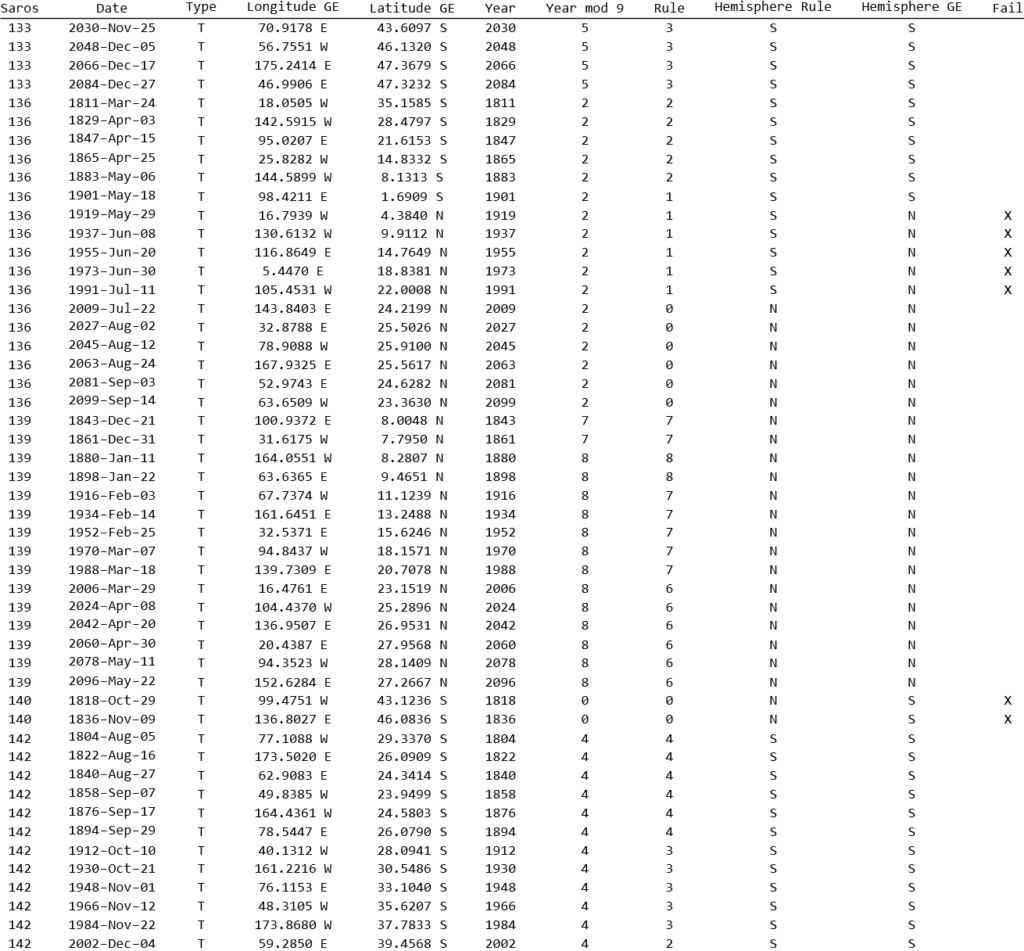
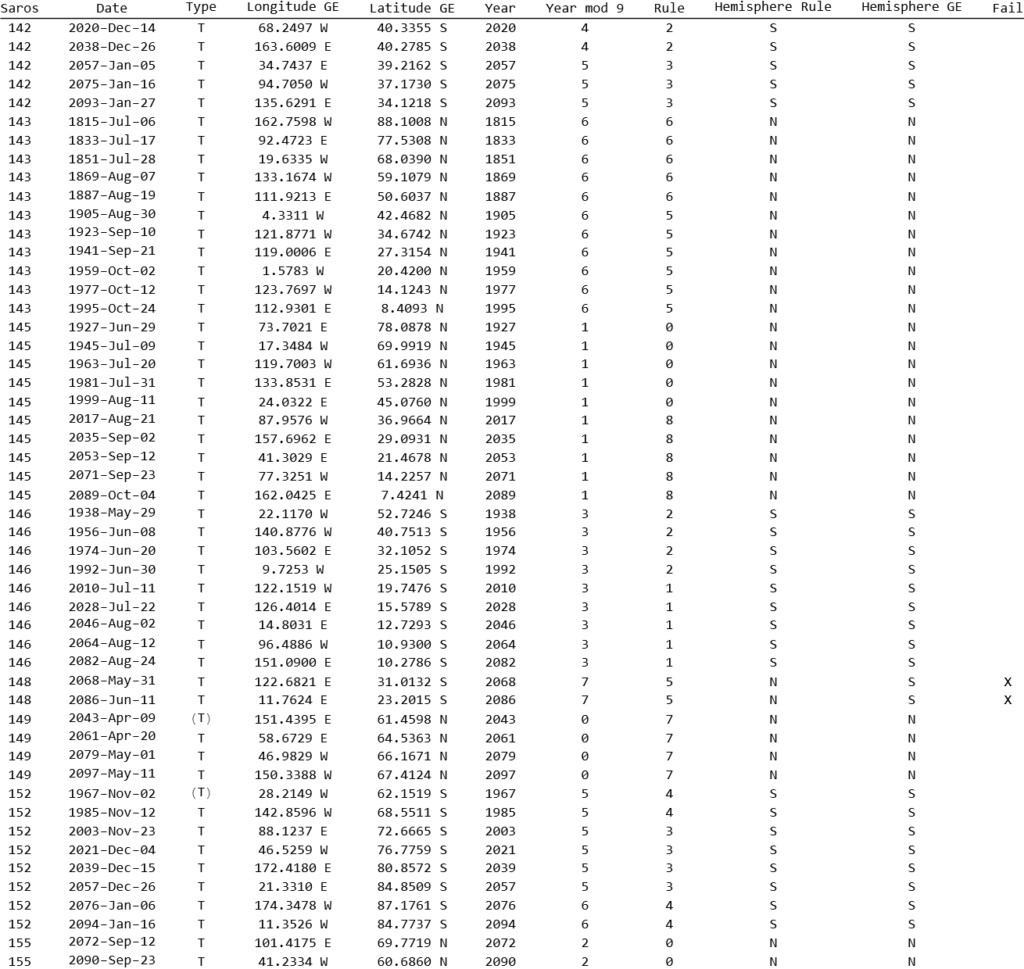
We can now put everything together. Here is a list of all total solar eclipses in the 19th, 20th and 21st century. The column “Hemisphere Rule” is the hemisphere of visibility determined by applying the rule, the numerical computation of which is reported in the column “Rule”. The hemisphere where the point of greatest eclipse is located is given in the column “Hemisphere GE”.
The list is sorted by Saros series and date to better highlight the fact that in many Saros series the hemisphere of visibility is the same. The rule does a pretty good job in predicting the hemisphere of visibility! There are of course exceptions highlighted in the column “Fail”. Failures are more frequent in correspondence of Saros series where some total eclipses have the point of greatest eclipse north of the Equator and some others south of the Equator. For example, Saros series 136, and we were kind of expecting that.
How the rule could have been derived?
By studying Table 3, the rule could be derived by simply collecting the values in the column “Rule” where the rule does not fail. A quick inspection reveals that the number 1, 2, 3 and 4 are in correspondence of Southern Hemisphere visibility, and 0, 5, 6, 7, 8 are in correspondence to Northern Hemisphere visibility. We can add 9 to the second series, as it is equivalent to 0.
A pivot table will make things clearer, and will show how the numeric intervals in the empirical rule might have been obtained.
| Rule | # eclipses with GE in Northern Hemisphere | # eclipses with GE in Southern Hemisphere |
| 0 | 19 | 3 |
| 1 | 6 | 14 |
| 2 | 3 | 20 |
| 3 | 1 | 26 |
| 4 | 0 | 21 |
| 5 | 15 | 6 |
| 6 | 19 | 0 |
| 7 | 26 | 0 |
| 8 | 12 | 10 |
| TOTAL | 101 | 100 |
The rule only considers the last two digits of the year, so it is an imperfect proxy for the reminder of dividing by 9. But because the rule operates with ranges of numbers (1, 2, 3, 4 and 0, 5, 6, 7, 8, 9), this imperfection is somewhat masked. For example, look at the total solar eclipses of Saros series 143. The reminder of dividing by 9 is always 6, but the rule produces 6 for some eclipses and 5 for others. Because the interval for Norther Hemisphere visibility is 0, 5, 6, 7, 8, 9, this jump from 6 to 5 is “masked” by the consecutive numbers in the interval (in this context, 0 and 9 are the same thing really).
Would using the entire year work better? Let’s consider another pivot table where the empirical rule is replaced by the reminder by dividing the entire year by 9.
| mod 9 | # eclipses with GE in Northern Hemisphere | # eclipses with GE in Southern Hemisphere |
| 0 | 10 | 8 |
| 1 | 20 | 0 |
| 2 | 13 | 14 |
| 3 | 4 | 22 |
| 4 | 0 | 23 |
| 5 | 5 | 20 |
| 6 | 21 | 2 |
| 7 | 6 | 6 |
| 8 | 22 | 5 |
| TOTAL | 101 | 100 |
Using the reminder by dividing by 9 of the whole year, a bit surprisingly, does not work as well. The inventor of the empirical rule seems to have been quite skillful in deciding to only use the last two digits of the year.
The “rule” for hemisphere of visibility is imperfect, but we can now see how it works. It is honestly quite clever!
